In the beginning, Magento was one of the biggest PHP applications. The main purpose of that platform was to cover all needs of store owners being universal and flexible. So, Magento store owners got a big and interesting e-commerce platform and the developers got a big “battlefield” for their implementations. A lot of things have been changed from year to year: servers became more powerful, Magento much faster and the number of platforms, developers and extensions has grown significantly. As a result, every store owner has a wide choice of the solutions that might be implemented for their stores. Unfortunately, very often it’s hard to predict how good is some add-on for a specific Magento installation because of different reasons. You are installing first, tenth, thirtieth extension and then realize: the store is much slower than it was before.
That’s right, the more features you have – the more operations are necessary to be handled by Magento platform. So, the first thing you should do it’s to get rid of as much extensions as you can. Believe or not, as a rule, more than 30% of store’s extensions have been never used, and you might even not guess that some of them are installed on your web store. To see the full list of the installed extensions go to [magento_root]/app/etc/modules. Here you can find the list of *.xml files. Each of them is corresponding to some extension. If you open some of the files with a text editor, you will see the following line there:
<active>true</active>
To disable the extension just change the parameter inside the ‘active’ node to FALSE in the following manner:
<active>false</active>
Remember, that’s the correct universal way to disable an extension. Do not use Admin->System->Configuration->Advanced admin page to turn off the extensions. It’s a common mistake since this tool does not disable an extension – it only disables the extension’s output. It might cause a lot of problems on your store.
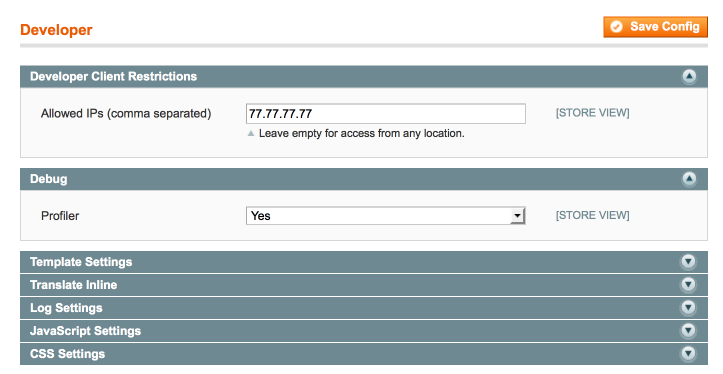
Well then, the unused extensions are supposed to be disabled, but the store is still quite slow. First of all, let’s use the built in Magento tools to check the performance of the separate parts – go to Admin->System->Configuration->Developer, find the ‘Profiler’ option in the ‘Debug’ section and enable it (set to ‘Yes’).
Also, if it is a production store you should restrict the output of your ‘experiments’ only to your IP address. At the very top of the same page you will find the ‘Developer Client Restrictions’ section. Just type your IP address inside of the section’s input.
Then, open your index.php file ([magento_root]/index.php) with a text editor, find the following line there:
#Varien_Profiler::enable();
and uncomment it:
Varien_Profiler::enable();
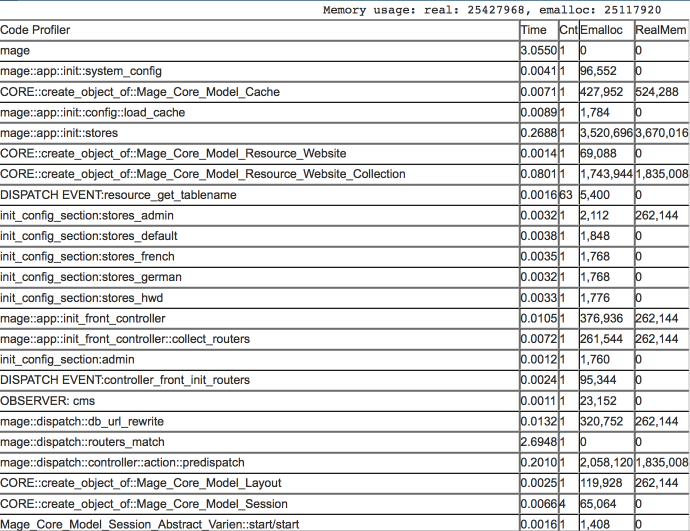
That’s it, the built in profiler is enabled. Look at the very bottom of your website:
Let us bring some light on all this information. The profiler is a tool which allows you to collect different information on the different application execution stages. In our case, the profiler is able to get a report about how long each part of our store is being loaded. So, we can investigate the profiler’s report and see what extension slows down the pages load. You can see the execution time, number of executions and memory usage in the table. The execution time param is the most interesting for us. However, it’s a bit tricky. If you try to make the sum of all values of the column, you won’t get the actual execution time. Very often the profiler’s method calls are placed one inside the other. On the screenshot above you can see that mage::dispatch::routers_match has the biggest execution time. However, it does not mean that there’s something wrong with the routers match operation in Magento. In that case, other profilers records are placed ‘inside’ the routers match record. That should be kept in mind. If you go down on the list you will find the most nested process. Let’s check the real example.
Look at the following screenshot:
Note that frontend/base/default/template/page/html/header.phtml execution time is quite long – 1.8251 ms. We can see the set of header’s child templates in the profiler’s list at the bottom of frontend/base/default/template/page/html/header.phtml. The slowest child is frontend/base/default/template/custom_extension/cart.phtml. Ok then, it’s a custom extension in our store which displays the shopping cart contents as a pull down menu in the header. If we disable this extension we will get the page load performance increased by more than one second. There are two major reasons of the bottlenecks like this one. The first one – it’s a bad code. An extension might have a big number of unnecessary database queries or the logic is simply bad organised and, as a result, resource consuming. In that case, you can ask your developer to check the extension or try to fix it yourself. The second reason is the need to get some additional information from the database or make some additional operations to have the necessary information. That is exactly what happened in our case: the header’s shopping cart pull down menu extension makes the additional database requests to get the shopping cart items information. By default (when there’s no additional shopping cart information on each page), Magento does not fetch this information. So, in cases like this one you should think twice: worth the header’s shopping cart one second of the page loading time or not, seriously.
Not always .phtml templates execution time reflects the bottlenecks. It’s useful to pay attention to OBSERVER records in the profiler’s report. Some extensions might execute an additional logic on the different system events. Just check what observer is the slowest and make sure that it’s not Magento core observer. Usually, the developers give names to their observers by adding a vendor name, something like this: ‘atwix_extmenu_add_topmenu_items’. So, if some custom observer slows down your system you should either disable the extension or investigate it for a reason of the bottleneck.
Good luck with your findings!


