Before running your store in production mode it’s very important to check as many Magento 2 performance aspects as possible, since even a minor performance issue might cost time and money in the future. Formally, a web application’s performance can be classified using two parts: frontend performance and backend performance.
Frontend performance represents how fast your web browser can get and render a content received from the server. Backend performance is a time that is necessary to calculate, prepare and send data to the client’s side. There are many tools that allow you to test frontend performance, from simple browser’s developer toolkit to more complex software. As for the backend performance testing – it’s a little bit tricky: you need to take in mind many nuances such as server load in different cases by different amount of visitors and other important parts. Fortunately, from year to year we have a good tendency of improving and simplifying ways of performance benchmarking. Let’s check what we have at this moment in latest Magento versions.
Magento is quite complex and heavy PHP product, however, it’s good optimized to run quite fast on modern hardware environments. If you run clean Magento 2 installation you see that it’s performance is not bad, considering the fact that we finally have the full page cache solution out of the box in the M2 Community Edition. After Magetno installation you go and check Magento Marketplace for any interesting extensions. Then you install some gorgeous looking custom theme and, probably, make some other custom implementations, add few thousands of products etc. If you are lucky enough and use quality solutions – your Magento 2 installation still has an acceptable performance visually.
That’s the exact stage when we should reconsider long term perspectives and think about the Magento installation size growing over the time. For now you have few customers, few products, a small pack of orders etc. But let’s imagine how this is going to change in future, especially if you are going to have a big store with plenty of customers. That’s the point where you should try to measure the Magento installation performance with more data. If you have a lot of free time and you really have fun of working with Magento admin panel – you can create 200k or more products/customers/categories manually (we are not sure if there’s a separate Magento category in the Guinness World Records). As an alternative, you can use various Magento sample data generators, which allow you to generate different entities automatically. But the easiest way here is to use the built in tools.
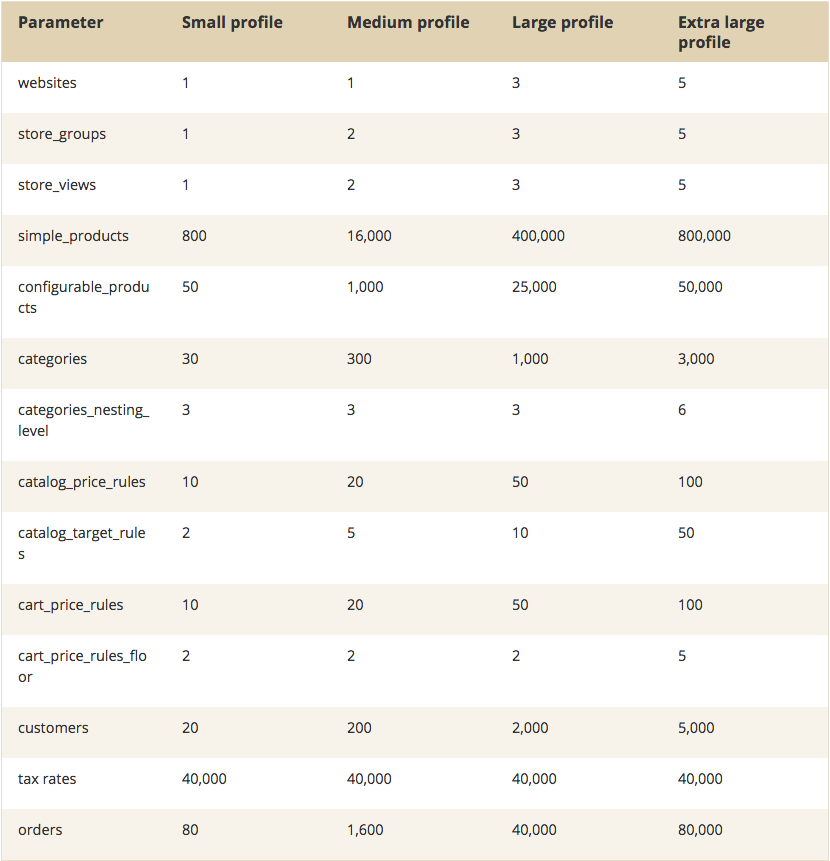
Not so long ago Magento has announced the official Magento Performance Toolkit. It’s compatible with Magento 1 Enterprise Edition but we also have it in Magento 2 community edition out of the box. Magento Performance toolkit is a fixture generator that allows you to fill your store with sample data of different sizes. In simply words, fixture is a temporary sample data that is used upon some test/benchmark etc. If you check the “[magento2 root]/setup/performance-toolkit/profiles/ce/” directory, you will see there 4 files that represents different fixture profiles (the filenames are self-explanatory). Each of these profiles contains a set of parameters that define how much data needs to be generated. We are also able to make a copy of any of these profiles with our own set of parameters.
There’s a built-in command in Magento 2 that generates fixtures depending on the chosen profile. In the table below you can check the difference between the profiles in details:

To run the fixture generation use the built-in Magento 2 console tool with a path to a corresponding profile as a parameter:
./bin/magento setup:perf:generate-fixtures setup/performance-toolkit/profiles/ce/small.xml
If the command is being executed without issues you will se a report with a number of records for each type of fixtures that are being generated and step-by-step execution report. Once the command is completed you should see a pack of new categories/products/users in your store.
From this stage you can use any tool to check the backend performance. You can choose NewRelic if you are going to perform some benchmarks during few days or weeks. Or, if you want to run benchmarks one by one, meanwhile making some changes in your Magento installation, you can try Gatling or JMeter. If you decide to use Gatling, you can check our own simple scenario for checking the frontend performance. Magento 2 has a scenario for JMeter out of the box that you can find in “setup/performance-toolkit/benchmark.jmx”.
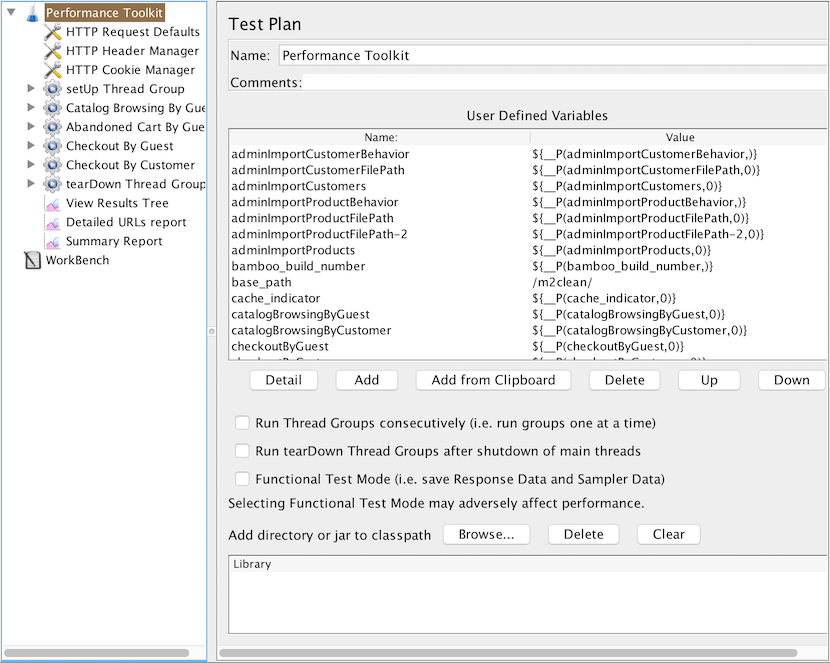
To use this file you should download JMeter from the official site. Extract the package contents somewhere on your computer, then run ./[jmeter_installation_dir]/bin/jmeter. You will see the JMeter GUI that allows you to operate the tool. Bu using the corresponding button, open Magento 2 benchmark profile: “[magento_installation_dir]/setup/performance-toolkit/benchmark.jmx”. Now you have all necessary steps loaded. All you need to do here is to specify few parameters for your Magento installation. Click on the “Performance Toolkit” item in the right menu and in the “User Defined Variables” area. You will see all predefined variables for the scenario:

You need to change “host” of your Magento instance URL, “admin” using an actual user name and “admin_password” using a working password (learn how to reset admin password with MySQL). Also, if you have your Magento installation in a specific subdirectory, you need to specify URL path in the “base_path” parameter. You can also experiment with other parameters if necessary.
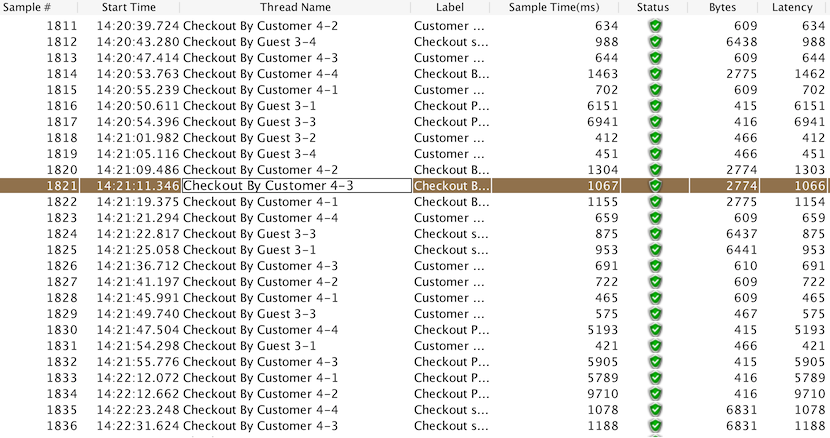
After you have fixtures generated, JMeter installed and configured, you can run the benchmark process. Please note, by default it will work only on a clean Magento 2 installation with generated fixtures and no sample data installed. Usually it takes some time to have the benchmark finished. At the end of the benchmark you will get a detailed report with execution time for each benchmark step:

You are also able to install an additional plugin for JMeter to aggregate and display the benchmark results as a graph or in other format. Now that you know the general steps in Magento backend performance testing, feel free to share your thoughts in the comments below or contact us for Magento performance audit services to ensure your store is lightning fast.
